
Travel Graph Lab
Maths · Cambridge O Level · Travel graphs · Distance, speed and time
Build a three-stage journey. Watch a vehicle move, read distance–time gradients and calculate distance from speed–time areas.
Free to explore. The interactive lab loads only when you start. No account or saved progress.
© teachly.lk
Things to try
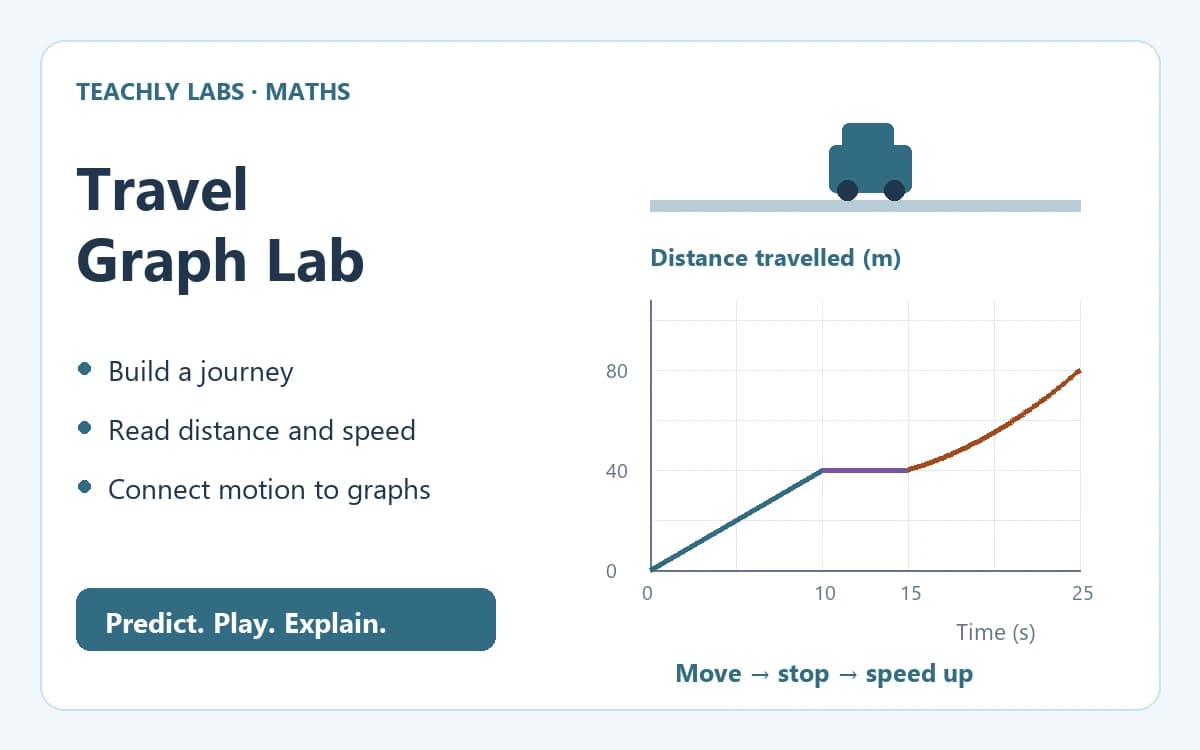
- Play the initial journey. Explain why the distance graph is horizontal during Stage 2 while the vehicle remains still.
- Switch to Speed–time and show area shading. Calculate 4 × 10 + 0 × 5 + ½ × (2 + 6) × 10 = 80 m. Check the average speed, including the stop.
- Load Steady journey. Predict the shape of both graphs. Double one stage duration: which totals change and which speed stays the same?
- Load Accelerate then brake. Compare the curved distance graph with the sloping speed graph. Explain why a downward-sloping speed graph can still mean moving forward.
- Load Stay at rest. Then increase one stage’s start and end speeds. Use the time slider to compare the exact boundary speed and the continuous distance.
Key ideas
- Speed is the gradient of a distance–time graph. A horizontal section means no distance is being added, so the vehicle is at rest.
- On a speed–time graph, horizontal means constant speed; an upward or downward slope means acceleration or deceleration. Speed stays non-negative here.
- Distance travelled equals the area under a speed–time graph. For a stage with linearly changing speed, distance = ½ × (starting speed + ending speed) × duration.
- Average speed is total distance divided by total time, including stops. Playback speed is only a viewing control and does not change the journey measurements.
- This forward-only, idealised model permits instantaneous speed changes between stages. The dashed jump is not a physically achievable finite acceleration. A completed observation need not end at rest.
Exam tip
Check the axis labels first. A flat distance–time graph means rest, but a flat speed–time graph can mean steady motion. Calculate graph areas with seconds and metres per second to obtain metres. Do not treat distance and displacement as interchangeable for a return journey.
Related
Want help with travel graphs · distance, speed and time?
Find a Maths tutor